What Is a Good Customer Effort Score and How to Measure It

Shreya Sharma
October 15, 2026
Customer Effort Score (CES) asks customers how easy it was to get their issue handled, usually on a 1 to 5 or 1 to 7 scale. You calculate it by averaging the answers or by taking the share who chose the easy end. A good CES is one that sits closer to the top of your scale than last month’s baseline did, measured with the same question at the same moment. No published benchmark can tell you that, because every team words, scales and times the survey differently.
A satisfaction survey tells you whether the customer liked the conversation. It does not tell you what the conversation cost them. A customer can rate a friendly agent five stars after explaining the problem three times, waiting a day for a reply and switching from chat to email to finish it. Every one of those steps is effort, and a high CSAT score can hide all of it.
CES was built to measure that cost directly. The stakes for a support leader are practical: effort shows up in repeat contacts, reopened tickets and customers who quietly stop asking for help. A CES score points at the specific friction behind those numbers, provided the survey is worded, scaled and timed so the number means something.
What follows is the question to ask, the arithmetic for each scale, a way to judge your score without a borrowed benchmark, and the causes a low score traces back to. The definition comes first, since every later number depends on it.
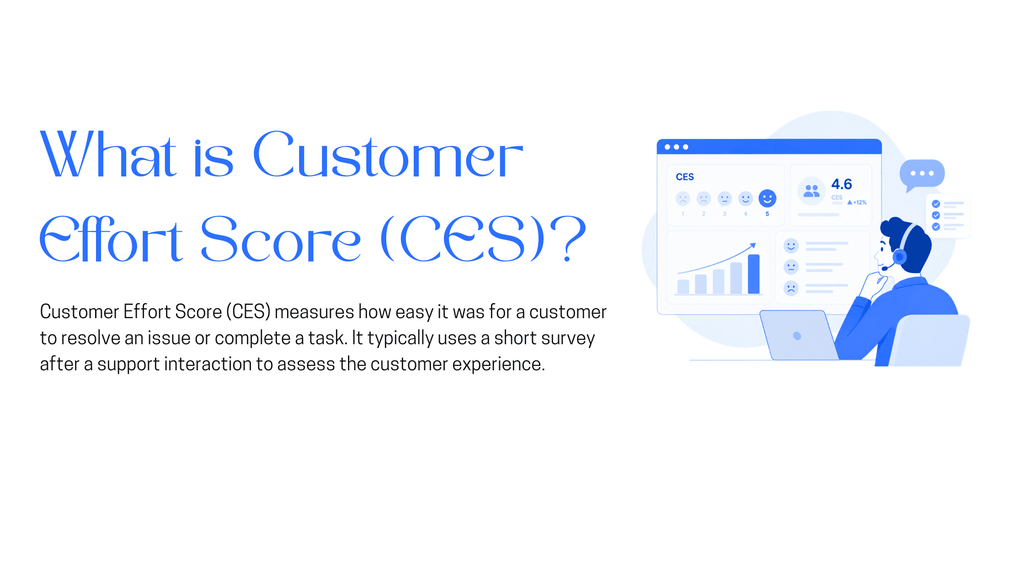
Customer Effort Score is a single-question survey that measures how easy it was for a customer to get a specific issue resolved. It rates one interaction, not the relationship. The question is asked after a support contact, a return, an onboarding step or any other task where the customer needed your help to finish something.
The metric came out of research published in the Harvard Business Review in 2010 under the title “Stop Trying to Delight Your Customers”. Its argument was that reducing effort does more for loyalty in service interactions than exceeding expectations does. You do not need to accept that claim wholesale to use the metric. It is enough that effort is concrete: a customer either had to repeat their order number or they did not.
That concreteness is what makes CES useful to an operator. A low CSAT score says the customer was unhappy, which could mean the policy, the product or the tone. A low CES score usually points at process: a transfer, a wait, a form, a second channel. Those are things a support team can change without rewriting the refund policy.
With the definition fixed, the next choice is the wording, and the versions in use do not all point the same way.
The wording you choose decides which end of the scale is good, so settle it before you send a single survey. Two versions are in current use.
An older original version asked “How much effort did you personally have to put forth to handle your request?” on a scale from Very low to Very high. On that scale a lower number is better. If you inherit a CES dashboard from another team, check which version it uses before you compare anything. A 2 is a good score on that one and a bad score on the others.
| Scale | Typical labels | Good end | Fits when |
|---|---|---|---|
| 1 to 5 ease | Very difficult, Difficult, Neutral, Easy, Very easy | 5 | You want a quick answer in chat or email with little room for misreading |
| 1 to 7 agreement | Strongly disagree through Strongly agree, with a neutral 4 | 7 | You want finer steps between answers and plan to report the share who agree |
| 5-point agree or disagree | Strongly disagree, Disagree, Neither, Agree, Strongly agree | Strongly agree | Your other surveys already use agreement statements and you want one format |
Keep the scale, the labels and the wording identical once you launch. Changing any of them starts a new baseline, and the old numbers stop being comparable. Add one optional free-text follow-up, such as “What made this harder than it should have been?” The number tells you where effort went up, and the comment tells you why.
Once responses arrive, each of these scales has its own arithmetic.
There are two ways to turn responses into a score. The average adds every answer and divides by the number of responses. The top-box share counts the customers who chose the easy end of the scale, usually the top two or three answers, and divides by the number of responses.
Both are standard. Pick one as the headline figure and keep the other as a check.
| Scale | Average | Share on the easy end | Hypothetical result |
|---|---|---|---|
| 1 to 5 ease | Sum of scores ÷ responses | Answers of 4 or 5 ÷ responses × 100 | 780 ÷ 200 = 3.9 average. 140 ÷ 200 = 70% easy |
| 1 to 7 agreement | Sum of scores ÷ responses | Answers of 5, 6 or 7 ÷ responses × 100 | 1,290 ÷ 250 = 5.16 average. 175 ÷ 250 = 70% agree |
| 5-point agree or disagree | Map Strongly disagree to 1 through Strongly agree to 5, then average | % who agree minus % who disagree gives a net score | 362 ÷ 100 = 3.62 average. 65% agree minus 20% disagree = net +45 |
The figures in the last column are hypothetical. For the 1 to 5 row, picture 200 responses: 10 people chose 1, 20 chose 2, 30 chose 3, 60 chose 4 and 80 chose 5. The scores sum to 780, so the average is 3.9, and the 140 people who chose 4 or 5 make up 70% of responses. For the agree or disagree row, 100 responses split 8, 12, 15, 40 and 25 from Strongly disagree to Strongly agree.
Neutral answers stay in the denominator for every method. Dropping them makes the share look higher than what customers told you.
To compare a 1 to 5 score with a 1 to 7 score, rescale both to 0 to 100. The formula is (average minus lowest point) ÷ (highest point minus lowest point) × 100, so the 3.9 above becomes 72.5 and the 5.16 becomes about 69.3. Use that conversion to line up an old program with a new one, and keep separate trend lines for each scale.
A number on its own still does not say whether it is good, which is the question the next section answers.
A good customer effort score is one that is closer to the top of your scale than your own baseline, measured the same way. No published CES benchmark can stand in for that comparison. Teams use different wording, scales and triggers. A survey sent after a password reset also measures a different kind of effort from one sent after a billing dispute.
Read the score against two reference points. The first is the ceiling. A 3.9 on a 1 to 5 scale sits 1.1 points below the top, and that gap is the room you have to work with. The second is your baseline: the same question, on the same channel, after the same kind of contact, over a comparable period such as last month.
Averages hide splits. A 4.0 can come from most customers choosing 4, or from a large group choosing 5 and a smaller group choosing 1 or 2. The second pattern means one path through your support is working and another is costing customers real effort. Always look at the share of answers on the hard end of the scale next to the headline, and read the comments attached to those answers first.
Split the score by contact reason, channel and who resolved the issue: the agent alone, a person alone, or the agent followed by a handoff. A company-wide average can hold steady while one segment falls, for example when a policy change makes returns harder but order questions get easier.
Base rates matter here. A move from 3.9 to 4.1 on 40 responses can be noise, while the same move on 2,000 responses is more likely real. Decide before you look which period and sample size your team will treat as enough, then hold to it. The segment with the worst score tells you where to look, and the timing of the survey decides whether that score is trustworthy at all.
The three metrics answer different questions, so the choice depends on what you need to change. CES and CSAT rate a single interaction. NPS rates the whole relationship. Our guide to CSAT covers the satisfaction side in more depth.
| Attribute | CES | CSAT | NPS |
|---|---|---|---|
| Standard question | How easy was it to get your issue resolved? | How satisfied were you with your experience? | How likely are you to recommend us to a friend or colleague? |
| What it measures | Effort in one interaction | Satisfaction with one interaction | Loyalty to the company overall |
| Common scale | 1 to 5 or 1 to 7 | 1 to 5 | 0 to 10 |
| Calculation | Average, or share on the easy end | Answers of 4 or 5 ÷ responses × 100 | % scoring 9 or 10 minus % scoring 0 to 6 |
| When to send | Right after the issue is resolved | Right after the interaction | On a schedule, apart from any single contact |
| What it misses | Whether the customer liked the outcome | How hard the customer had to work | Which interaction caused the change |
Use CES when you want to find and remove friction in a support process. Use CSAT when the question is whether a conversation or an agent met the customer’s expectations. Use NPS to track customer loyalty at the relationship level, and do not expect it to explain a single ticket.
You can run CES and CSAT on the same contact, but stop at two questions. When CSAT is high and CES is low, the customer liked the person and disliked the process. That combination points at a handoff, a form or a wait, and the team’s tone is probably fine.
Whichever pair you run, the moment you send the survey shapes the answers as much as the wording does.
Send the CES survey as soon as the issue is resolved, in the channel where the conversation happened. The customer still remembers each step, and the answer describes this contact instead of a blend of the last few.
For a chat, ask at the end of the conversation. For email or a ticketing system, trigger the survey when the ticket moves to solved. Waiting for the ticket to close days later blurs the customer’s memory of the steps.
Survey the conversations that ended in a handoff as well as the ones the agent or a person closed alone. Selection bias creeps in when only smooth conversations get a survey. The contacts that went through a transfer often carry the most effort, and leaving them out makes the score look better than what customers went through.
Unresolved conversations need a rule. A customer who gave up cannot rate how easy resolution was, so track those separately as abandoned or unresolved, and send the CES question only once the issue actually closes. Otherwise a pile of “I never got an answer” responses lands in the same average as resolved contacts and muddies both.
How often any one customer sees the survey is your team’s call. A cap, such as one survey per customer in a set number of days, keeps a frequent contact from being asked after every message. Whatever cap you pick, write it down and keep it, since changing it shifts the baseline.
Low CES answers tend to trace back to a short list of causes. Cognitive load theory helps explain why. Working memory holds only a few items at once, and every detail a customer carries between steps adds to the load: an order number, what they told the last person, which tab has the form. Each driver below makes the customer carry more.
| Effort driver | What the customer has to do | Where it shows in your data | First fix to try |
|---|---|---|---|
| Repeating information | Give the same order number, account email or problem description twice | Comments that say “again” or “already told” | Pass the thread and customer details to whoever picks up next |
| Channel switching | Move from chat to email or phone to finish the task | One issue appearing as contacts on more than one channel | Let the first channel complete the task where it can |
| Transfers | Wait for another person or team and explain again | Lower scores on conversations with a handoff or reassignment | Route to the right owner the first time and keep the history attached |
| Waiting | Wait for a first reply or for a follow-up after a promise | Scores falling as first response time or resolution time grows | Answer routine questions immediately and set honest reply times for the rest |
| Doing it yourself | Follow a link to a form or help article to finish the task | Repeat contacts on the same issue within a few days | Complete the action inside the conversation where a system allows it |
For one month, tag the comments on your lowest scores against these five rows. The tally shows which drivers dominate in your queue. Channel switching and doing it yourself both fall as first contact resolution rises, because the issue ends in the conversation where it started.
Every effort driver asks the customer to do work your systems could have done. Several of them can be removed inside the conversation itself, which is where an AI agent comes in.
An AI agent lowers effort only when it removes a step. A faster reply that leaves the customer with the same number of steps changes little. In YourGPT, three parts of the agent reach the drivers above directly, and a fourth measures the result.
The agent answers from the sources you train it on, such as your help center, policy pages, documents and FAQs. The customer gets the answer in the chat they opened instead of a link to go and read.
The same trained agent connects to your website, WhatsApp, Instagram, email and other channels, so a customer who starts on WhatsApp can finish there. For a team trying to cut channel switching, that is the omnichannel part of the job.
A link to a returns form resolves nothing until the customer fills it in. Connect the agent to your systems through Functions, REST APIs, webhooks, MCP servers or AI Studio, and it can look up the record and act on it inside the chat. The Shopify template in AI Studio, for example, includes Order Status and Return Order scenarios. Customers feel the gap between answering a question and resolving it, and CES is where it shows.
When set up correctly and maintained, YourGPT agents resolve up to 90% of repeated queries autonomously. The rest still needs people, and how they reach people decides the score.
You can set up human handoff in three ways. A Request Human button lets the customer ask, Quick Replies escalate on phrases such as “talk to human”, and AI Studio handles advanced routing on intents or Unable to Answer events. Which triggers count as a reason to escalate is your team’s decision.
When a conversation reaches a teammate, they see the entire chat thread: the customer’s messages, the agent’s replies, timestamps and visitor details. The teammate reads what was already said and picks up from there. From the customer’s side, that is a clean escalation, where the next reply builds on what they already said.
In AI Studio, a Feedback node collects a rating at the point in the conversation where you place it, usually at resolution. It supports Stars for a 1 to 5 scale and a Slider with a minimum and maximum you set, which covers a 1 to 7 scale. Results appear in the Analytics dashboard, where you can track scores over time.
Questions the agent could not answer land in Self-Learning, where your team reviews them and trains the correct answer. Those unanswered questions and the lowest CES comments often describe the same gap from two sides.
Yes. Use the identical question, scale and trigger, then report the two groups as separate segments. If the wording differs, you cannot tell whether a gap comes from the agent or from the survey. Add a third segment for conversations that started with the agent and ended with a person, since that path usually carries the most effort and shows whether your handoff is working.
Only loosely. A published figure rarely states its exact wording, scale direction, trigger and mix of contact reasons, and each of those moves the number. A company surveying after password resets will score higher than one surveying after billing disputes. Use outside figures as a curiosity, and set targets against your own baseline and the top of your scale.
Look at the distribution and the segments before trusting the average. A stable 4.0 can hide a growing group choosing 1 or 2 while another group moves up to 5. Split by contact reason and by who resolved the issue, then read the comments on the lowest answers. The segment that fell usually matches a recent change in policy, routing or staffing.
It limits what you can conclude, and it can bias the result. Customers who had a very easy or very hard time answer more often than those in the middle. Ask in the conversation itself rather than in a later email, keep it to one question plus an optional comment, and judge trends over a full month rather than week to week.
Partly. Rescale both to 0 to 100 so you can place old and new scores on one chart, but start a new baseline on the switch date. The wording usually changes with the scale, and customers answer an agreement statement differently from an ease question. Run both for a short overlap period if you can, so you see how far the two versions sit apart.
Customer effort score turns friction into a number you can track: one question, a fixed scale and a survey that goes out when the issue closes. The number is only as good as its consistency. Once wording, scale and trigger stay the same, your own baseline and the top of the scale are the only benchmarks that matter.
Behind a low score sit the same few causes: repeated information, switched channels, transfers, waiting and work handed back to the customer. An agent that answers in the conversation, acts on the request and hands off with the thread attached removes several of them at once. The CES segments show which ones it actually removed.
Train the agent on your help pages, connect one action, then add a Feedback node for CES.
Tier 1 support handles first contact. See how Tiers 0 to 3 differ and what changes when an AI agent becomes your first line.

The 12 customer service metrics to track when an AI agent resolves tickets, with a formula for each and a baseline built from your own last month.
Calculate cost per ticket with one formula and a free calculator, then compare it with the cost of a conversation an AI agent resolves.
Omnichannel support means every channel answers from the same knowledge. Train one AI agent, pick your first channel, and test that answers match.

Self-learning AI agents log the questions they miss. Learn how human review turns those gaps into trained answers and how to run the weekly loop.
Train an AI agent on your return policy, connect the Shopify template in AI Studio to check real orders, and route exceptions to your team.