How to Calculate Cost Per Ticket in Customer Support

Rajni
October 9, 2026
Cost per ticket is the total cost of running your support team for a period, divided by the tickets that team handled in the same period. Load the top line with everything the team costs to run, including payroll with taxes and benefits, tools, outsourcing, and a share of overhead. To judge an AI agent, price its full cost, divide by the issues it resolved, and compare the blended cost per resolution of the whole queue before and after. A ticket that comes back gets paid for twice, so cost per resolution is the number that keeps cost per ticket honest.
Someone asks for cost per ticket in a budget meeting, and the answer is whatever the person with the spreadsheet can pull together by that afternoon. One manager divides agent salaries by closed tickets. Another adds the help desk bill and the overflow vendor, then divides by every ticket created. Both call the result cost per ticket, and the two numbers can sit far apart for the same queue.
A ticket here means one customer request your support team handles, whether it arrives by email, chat, phone, or a contact form. The formula is short. Most of the work is deciding what goes above the line and what counts below it. Write those choices down, so next month’s number means the same thing.
The formula and calculator come first, followed by the rules for each input and a worked month. The comparison with an AI agent comes last, because it only holds up once your own number is solid.
Enter one month of costs in a single currency. Cost per ticket equals payroll plus tools plus other costs, divided by tickets handled.
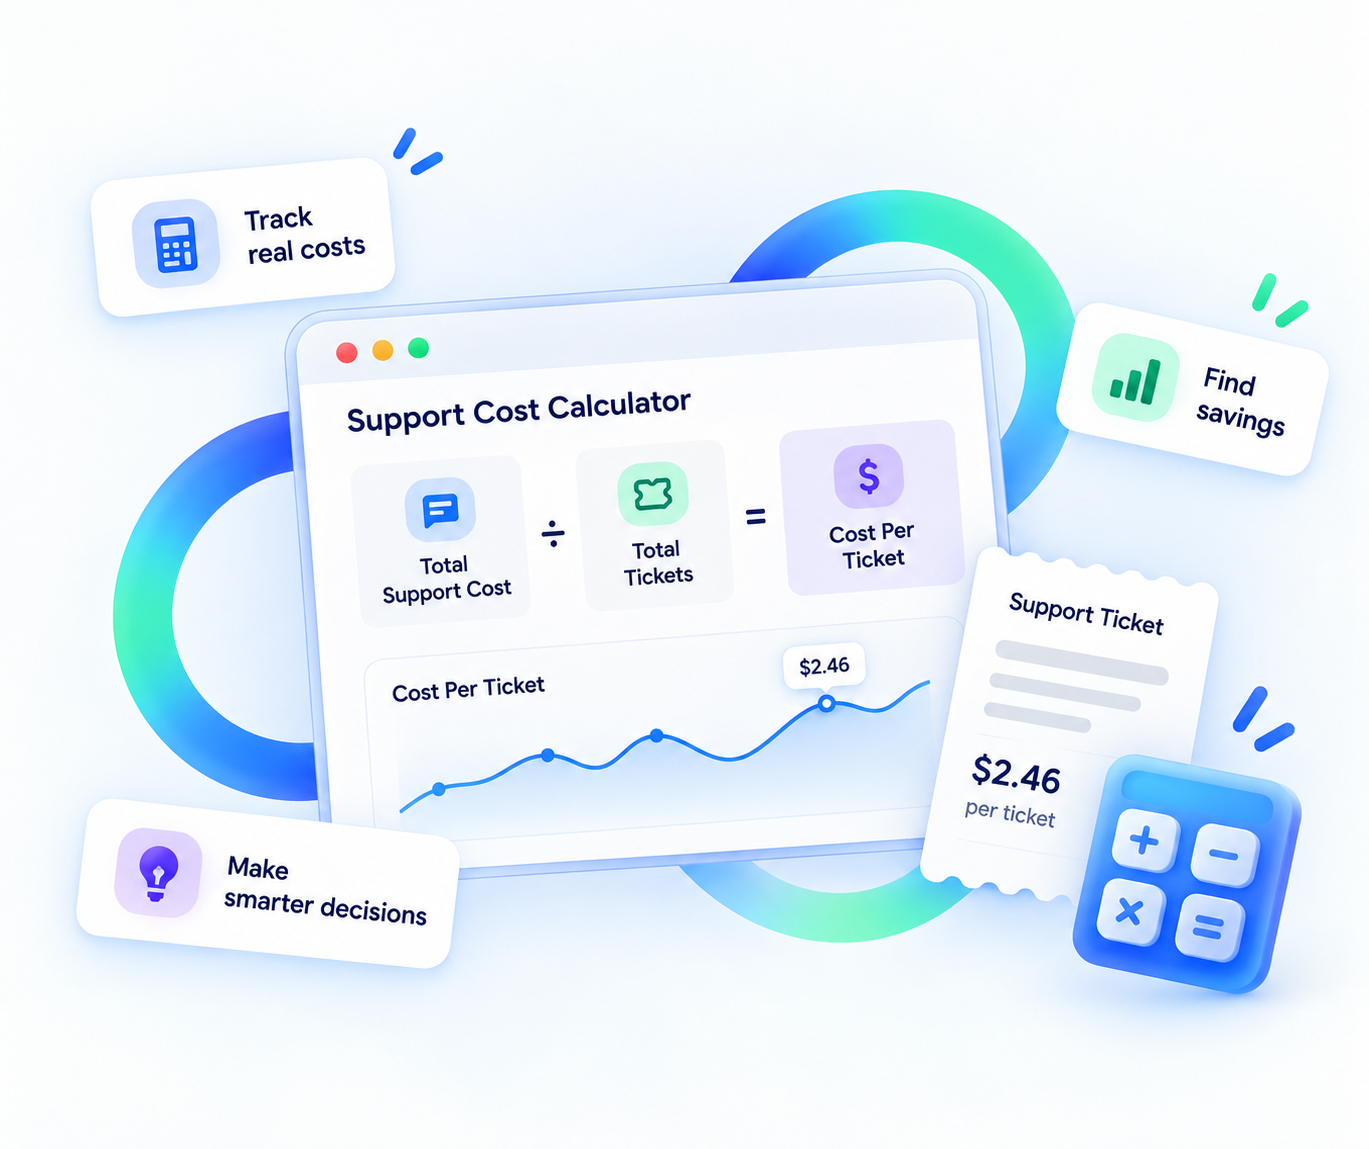
Cost per ticket = (fully loaded payroll + tools + outsourcing and overhead) ÷ tickets handled in the same period. The fields above hold a hypothetical month, which the worked example below takes apart line by line. Replace them with your own figures and the result updates as you type.
Two rules keep the number honest. The cost and the ticket count must cover the same dates. The team whose cost sits on top must also be the team that handled the tickets below it. A month is the usual period because payroll, invoices, and ticket exports all line up on it.
If the output looks lower than you expected, check the top line first, since that is where missing costs hide.
Salary is the obvious cost on the top line, and on its own it understates what a support hour costs. Fully loaded means every cost attributable to running the team. MetricNet’s definition of service desk operating expense makes a useful checklist. It covers salaries and benefits for agents and for indirect staff such as team leads, QA, trainers, and managers, plus technology and telecom, facilities, and travel, training, and supplies.
| Calculator field | Include | Leave out |
|---|---|---|
| Payroll | Salaries, overtime, bonuses, employer taxes, benefits for agents, team leads, QA, and the support manager | People outside support who answer the odd ticket, unless you allocate their time |
| Tools | Help desk seats, phone and SMS lines, chat widget, knowledge base, QA and workforce tools | Company-wide software support would have anyway, such as email and office suites |
| Other | Outsourcing and overflow vendors, recruiting, training, and a share of office, equipment, and IT | One-off projects, such as a help center migration, which you report separately |
Allocate shared people by time. If a product specialist spends a fifth of the week on escalations, a fifth of their loaded cost goes into payroll. The same rule covers the manager who splits time between support and sales.
Overhead is the input people argue about. Pick one method, such as the support team’s share of total headcount applied to office and IT costs, and write it next to the number. The method matters less than using the same one every month.
Leave out anything you cannot tie to the period. An annual software contract becomes one twelfth per month. Spread a training program paid in January across the year it serves, or January’s cost per ticket jumps for reasons unrelated to January’s work.
If an AI agent already answers part of your queue, keep its plan out of this total. The agent gets its own calculation later, and counting it in both places would charge your team for work it never touched.
With the costs in one total, the ticket count is the next thing that can quietly skew the result.
The bottom of the formula looks easier than the top, but a loose count moves the result just as much. Count tickets your team worked on and closed during the period, from every channel the cost covers. Export them from your ticketing system for the same dates as the costs.
Then clean the export before you count:
The fourth rule matters more than it looks. A reopened ticket counted twice adds to the bottom of the formula without adding any finished work, which pushes cost per ticket down. Cost per resolution, further down, is built to catch it.
If some tickets never reached a person because a help center article or an agent answered them first, keep them out of this count. They belong on the automated side, which you will price separately. Count what your team handled, since that is what the payroll paid for.
With a clean total on both lines of the formula, you can run a whole month through it.
Here is a hypothetical support team to show the arithmetic end to end. It has six agents and one team lead, handles email and chat, and sends overflow to an outside vendor during busy weeks. None of these figures is a benchmark.
| Hypothetical month | Amount | What it covers |
|---|---|---|
| Salaries | $30,000 | Six agents and one team lead |
| Employer taxes and benefits | $7,500 | Payroll taxes, health cover, retirement contributions |
| Tools | $2,500 | Help desk seats, live chat tool, QA tool, knowledge base |
| Outsourced overflow | $3,000 | Vendor hours during two busy weeks |
| Overhead share | $2,000 | Office, equipment, IT, training |
| Total support cost | $45,000 | Payroll $37,500, tools $2,500, other $5,000 |
| Tickets handled | 6,000 | After removing spam and merging duplicates |
| Cost per ticket | $7.50 | $45,000 ÷ 6,000 |
Those are the defaults in the calculator, so you can check the $7.50 yourself. Now keep only the $30,000 in salaries and divide by the same 6,000 tickets. The result is $5.00.
That $2.50 gap is the difference between a salaries-only number and a fully loaded one. It is one reason two teams can report different figures for similar work. Before you compare your number with anyone else’s, ask what they put on top.
A single blended figure can also hide an expensive channel. If phone calls take far longer than chat replies, you can split payroll by the share of agent hours each channel uses and run the formula per channel. The blended number stays the headline, while the split shows where time goes.
Cost per ticket now tells you what the team spends per request handled. It does not yet tell you what you spend to fix a customer’s problem, and that is a separate number.
A ticket is a unit of work. A resolution is a customer problem that stayed solved. The two counts drift apart when the same issue comes back as a second ticket, or when a ticket closes before the customer has what they asked for.
Cost per resolution = total support cost ÷ issues resolved in the same period. Count an issue once, however many tickets it took, and only when the customer did not come back about the same thing. The difference between answering and resolving is the whole reason this second number exists.
Go back to the hypothetical month. Suppose 600 of the 6,000 tickets were customers writing again about an issue already marked closed, and every issue was solved by month end. That leaves 5,400 issues resolved, and $45,000 ÷ 5,400 is about $8.33 per resolution.
Now suppose the team is told to push cost per ticket down and starts closing tickets faster. Customers come back more often, tickets rise to 6,600, and the resolved issues stay at 5,400 on the same $45,000. Cost per ticket falls to about $6.82 while cost per resolution stays at $8.33.
| Hypothetical month | Tickets | Issues resolved | Cost per ticket | Cost per resolution |
|---|---|---|---|---|
| Baseline | 6,000 | 5,400 | $7.50 | $8.33 |
| Closing faster | 6,600 | 5,400 | $6.82 | $8.33 |
A customer who has to write twice makes your cost per ticket look better. That is Goodhart’s law in a support queue: once a measure becomes a target, people find ways to move the measure without moving the work. Track first contact resolution and CSAT beside it, so a falling cost per ticket has to explain itself.
Cost per resolution is also the only fair unit for the AI comparison. An agent reply that sends the customer back to your team has not saved a ticket. It has added a conversation before the ticket.
Once the number is stable, the useful question is why it moves. MetricNet’s analysis comes from IT service desks, but the logic carries over to customer support because both are labor-intensive and most of the cost is people.
| Driver | Why it moves the number | What you can do |
|---|---|---|
| Handle time | MetricNet names handle time and agent utilization as the two most important drivers. More minutes per ticket means more payroll per ticket. | Build better macros and a stronger knowledge base, and route tickets to the right person first. |
| Agent utilization | Paid hours with no ticket in progress raise the cost of every ticket that does arrive. | Schedule to the arrival pattern of your volume, not to an average day. |
| Wage rates | MetricNet found a ten-minute ticket can cost $10 at one desk and $25 at another, and wage rates explain the gap. | Mostly set by location, so compare against your own trend rather than another region’s figure. |
| Channel mix | Chat costs less than voice because agents can run several chats at once, and self-help costs the least. | Move repeatable questions to chat, a help center, or an AI agent. |
| Repeat contacts | Every repeat is paid work that resolves nothing new. | Fix root causes and watch first contact resolution beside cost. |
| Turnover and absence | Replacing an agent costs about $12,000, and absence forces overtime or extra headcount. | Treat retention as a cost lever, because it is one. |
What about a benchmark? Published ranges are wide. MetricNet’s 2021 North American figures vary by more than 100 times between the cheapest channel, self-help, and the most expensive, walk-up. Wage rates alone can move the same ticket from $10 to $25. A single industry average hides all of that, so your own trend, calculated the same way every month, is the benchmark that matters.
An AI agent is priced differently from a support team, so it needs its own calculation before the two can sit side by side. YourGPT pricing, checked on 1 October 2026, lists Essential at $39 a month, Professional at $79, and Advanced at $349 on annual billing. Month-to-month prices are $59, $129, and $499, and Enterprise uses a custom yearly contract.
Usage is billed in AI Credits, and credit use depends on the model you select and the conversation workload. A longer conversation runs more AI tasks, and some models use more credits per task than others. That is why there is no fixed price per conversation to plug in here.
Your own number comes from a pilot month on real conversations:
The second step decides whether the result means anything. A conversation where the customer gave up counts as unresolved, and so does one that ended in a handoff. We use the same strict definition when we measure AI resolution.
Some questions never need the model at all. Quick Replies answer exact phrases or patterns with a fixed message and do not consume AI Credits. A fixed answer, such as your returns address, costs nothing in credits to serve.
When set up correctly and maintained, YourGPT agents resolve up to 90% of repeated queries. That ceiling applies to the questions that repeat and can be answered from your pages or connected systems. Refund exceptions, disputes, and anything that needs a judgment call stay with your team, at your team’s cost.
With a cost per resolution on each side, the comparison becomes a question about next month’s budget. Setting the two figures head to head misleads, because the agent takes the repeated questions and your team keeps the harder ones. The useful question is what the whole queue costs when the agent takes its share.
Write the blended month like this:
To size the tickets left for people, go back to the export and tag the tickets that repeat and can be answered from a page or a system lookup. Multiply that count by the agent’s resolution rate from the pilot. Subtract the result from the total, and what remains is your team’s share. Deflection rate is the running version of that share once the agent is live.
Here is the part a finance lead will challenge, so answer it first. Cost per ticket is an average, and payroll does not shrink because the ticket count did. If the same six agents and team lead handle fewer tickets next month, payroll stays at $37,500 and cost per ticket goes up. The saving becomes real only when the staffing plan changes, such as a hire you do not make or an overflow contract you do not renew.
That is why the comparison belongs next to a staffing decision. The AI ROI calculation turns these same inputs into a return figure for approval. For value that never shows up in a cost line, read how we approach AI agent ROI.
The tickets the agent hands over still need a clean route to a person. You can set up human handoff in three ways: the Request Human button, Quick Replies with escalation to a human turned on, and AI Studio for fully customized routing. Each escalated conversation lands in your human count, and it should, because your team does the work.
No. A single figure rarely travels well between teams. Cost per ticket moves with channel mix, ticket complexity, wage levels in your region, and what each team puts in the fully loaded total. A published average rarely states those choices. Your own trend is the useful comparison: the same inputs and the same ticket rules, month after month, with the method written beside the number.
Yes, for the share of time spent running support. A manager who only runs the support team goes in at full loaded cost. One who also manages sales or success goes in at the support share of their week. Team leads and QA reviewers belong in payroll too, because the queue could not run without them.
Yes. The formula is the same: total service desk cost for the period divided by tickets handled. The inputs differ. Tickets are usually incidents and service requests from employees, and the cost often includes tiered support staff and the tools that manage devices and access. Count incidents and requests separately if they take very different amounts of time.
Monthly, once invoices and payroll for the month have closed. Keep one row per month with the four inputs, the ticket rules, and the result. Recalculate the agent side whenever you change plans or switch models, since credit use depends on the model. Three months of rows tell you more than any single month.
No. Keep the team’s number on the tickets people handled, and report the agent’s cost per resolution beside it. Mixing them divides human payroll by work the team never touched, so the team’s number drops without anyone working differently. Use the blended cost per resolution when you need one figure for the whole queue.
Cost per ticket is a short formula with two lines that need care. The top line is every cost that exists because the support team exists, loaded and allocated for the same month. Below it sit the tickets that team handled, cleaned so that one problem counts once.
Cost per resolution sits next to it and keeps it honest. It stays flat when a queue closes tickets faster without fixing more problems, and it is the unit that lets you compare a support team with an AI agent. With both numbers on one row each month, the budget conversation starts from your own queue.
Train an agent on your help pages, run it for a month, then divide its cost by resolutions.

Omnichannel support means every channel answers from the same knowledge. Train one AI agent, pick your first channel, and test that answers match.


Self-learning AI agents log the questions they miss. Learn how human review turns those gaps into trained answers and how to run the weekly loop.
Train an AI agent on your return policy, connect the Shopify template in AI Studio to check real orders, and route exceptions to your team.

WISMO means Where Is My Order. Measure your WISMO share from last month’s tickets, fix the tracking gaps, and let an agent answer order status.

Run WordPress customer service alone. Train a YourGPT agent on your help pages, test it on real tickets, install the plugin, and get only the exceptions.

Learn how to judge Shopify AI resolution rates with clear formulas, a worked example, ticket-level checks and practical ways to improve support quality.