Customer Service Metrics and KPIs to Track When AI Handles Support

Shreya Sharma
October 13, 2026
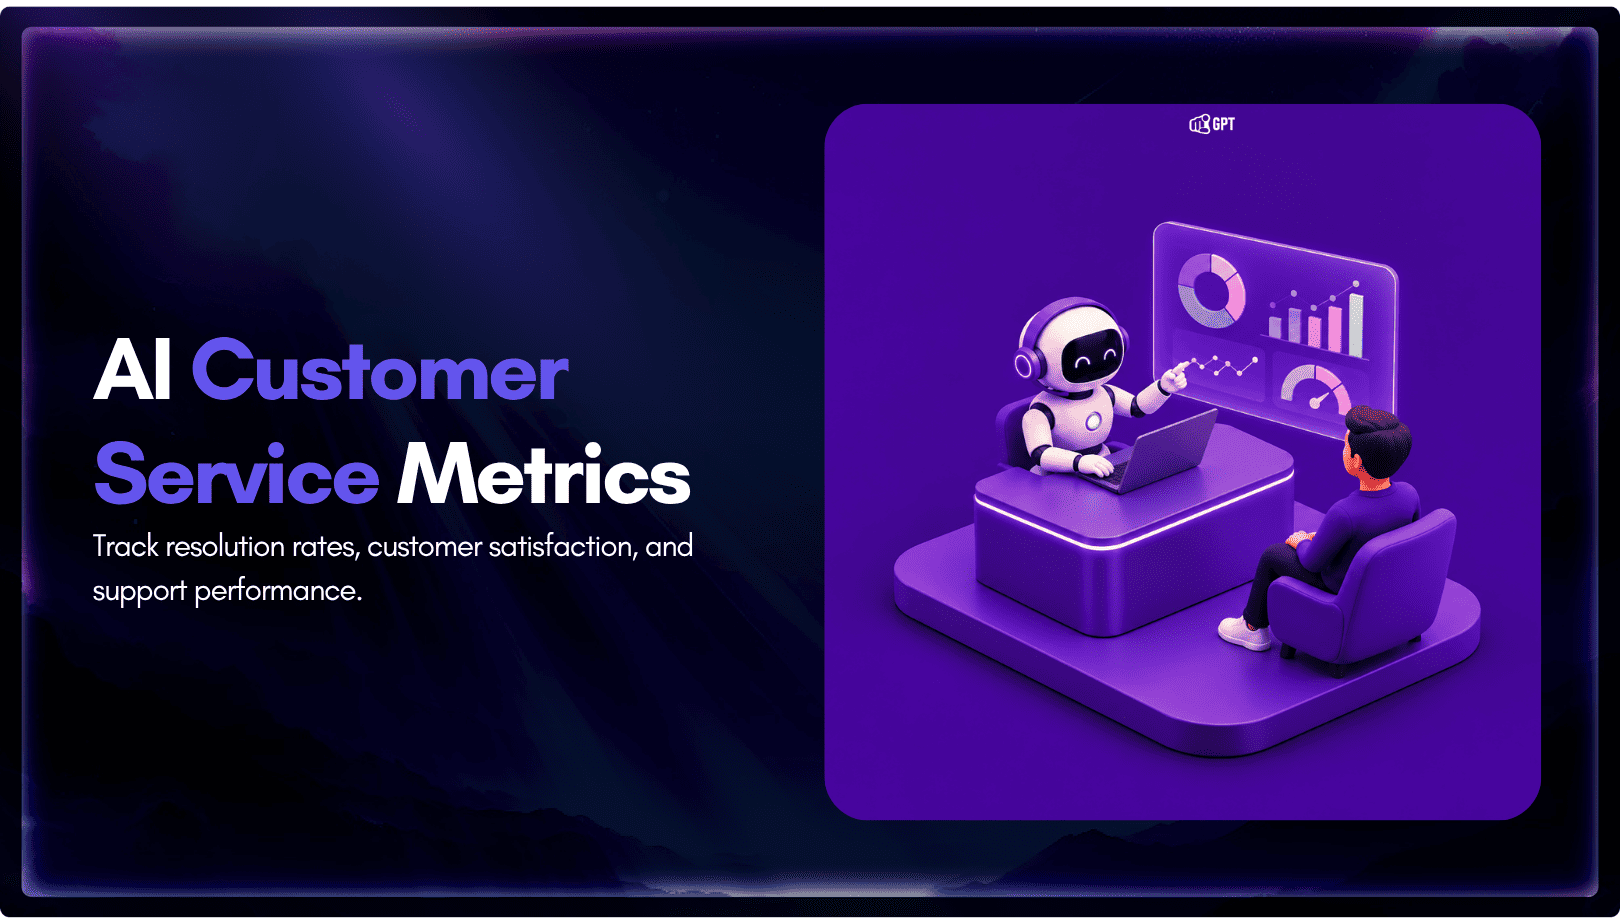
When an AI agent handles support, make resolution rate your headline metric and read it beside handoff rate, 72-hour return rate and knowledge gap rate. Track 12 customer service metrics across outcome, speed, quality and cost, and treat average handle time as a number for human work only. Set every target from your own last full month, because a benchmark from someone else’s queue describes a different ticket mix.
Support dashboards grew up around a team of people answering tickets. Handle time, first response time and ticket volume all assumed a person on the other end, and each figure described part of that person’s shift.
An AI agent changes what those same numbers mean. The agent replies in seconds, so first response time collapses toward zero whether the answer was right or not. Deflection rises when a customer gets the answer, and it also rises when a customer gives up and closes the window. A team can report a better month while the same customers write back two days later.
The fix is to keep the metrics that still describe the customer’s result and redefine the ones that now describe the software. Start with the full sheet of 12, then work through what changes in each group and how to set a baseline from last month’s data.
Vendors do not agree on what “resolved” means. The table shows how three platforms define it in their own documentation.
| Platform | What counts as resolved | Silence | A late return |
|---|---|---|---|
| Intercom (Fin) | The customer confirms the answer helped, or leaves without asking for more help after the last answer | Counts as an assumed resolution after 24 hours | Deducted if the customer returns to the same conversation |
| Zendesk | A request the AI agent resolved without escalation to a human agent, billed as an automated resolution | Not stated on the pricing pages | Not stated on the pricing pages |
| YourGPT | An eligible request whose intended outcome was completed, with required actions confirmed by the responsible system and the AI keeping ownership | Inactivity timeouts do not count | Does not count if the same customer returns with the same issue inside the recontact window |
The definition sets the invoice as well as the dashboard. Intercom prices a resolution at $0.99, and Zendesk charges $2 per automated resolution over the plan allotment on pay as you go, with lower rates for committed volume.
YourGPT reports 90%+ AI resolution on eligible repeated requests in maintained deployments. The qualifier does real work in that sentence, because the denominator is the eligible set and not every conversation that arrives.
Treat any vendor percentage as a number measured against that vendor’s definition. Your own baseline, built from your own definitions, is the only figure you can compare month to month.
Every formula in the sheet below depends on these. Write them down once and change them only at a quarter boundary.
1. Genuine conversation. One customer request thread, counted once across channels. Greetings with no question, spam, internal tests and merged duplicates are removed from every count.
2. In-scope conversation. A request type on a written scope list, fixed before you measure. A type belongs on the list only when the agent has the knowledge and the connected actions to finish it. A refund exception that you route to people by design stays off the list. The same list feeds the numerator and the denominator, so scope cannot shift afterward because a topic turned out to be hard.
3. Resolved conversation. Three conditions hold together. The agent delivered the outcome the customer asked for, which means an accurate answer to an information request or a success confirmation from the system of record for an action. No person took ownership. The customer either confirmed the outcome or stayed silent through the closing window after the final answer. Track confirmed and assumed resolutions separately. A session closed by an inactivity timeout, with no answer delivered, is not a resolution.
4. Handoff. A conversation where a person takes full ownership and the agent stops. A teammate who gives one approval while the agent keeps the conversation is not a handoff.
5. Recontact. The same customer returning about the same issue, on any channel, within 72 hours of the agent’s final answer. Match on customer ID plus the intent label, and add an order or account ID wherever one exists.
The 72-hour window is a default and not a law. Intercom closes an assumed resolution at 24 hours, and some first contact resolution definitions use seven days. Choose the window from how long your customers take to notice a wrong answer. A shipping error can surface in a day while a billing error can take a week. Then keep it fixed.
Every formula below uses counts you can pull from one month of conversations and tickets. Two terms need fixing before you count. An eligible conversation is one the agent could have finished with the sources, actions and mode it had that month. A return is the same customer coming back with the same issue within 72 hours of the agent’s reply.
The rows run in four groups: outcome, speed, quality and cost.
| Metric | Formula | What AI changes |
|---|---|---|
| Resolution rate | (Completed without handoff − returns within 72 hours) ÷ eligible conversations × 100 | Becomes the headline, because it counts finished work the agent kept |
| Deflection rate | Conversations that never reached a person ÷ all conversations × 100 | Counts customers who gave up as wins, so it needs a check beside it |
| Handoff rate | Conversations passed to a person ÷ conversations the agent started × 100 | New for most teams, and it sizes the work your people still own |
| 72-hour return rate | Returns within 72 hours ÷ conversations completed without handoff × 100 | Catches answers that sounded finished and were not |
| First response time | Sum of (first reply time − first message time) ÷ conversations | Drops to seconds for the agent, so measure the wait after handoff separately |
| Average handle time | Total handling time ÷ tickets handled | Means little for agent conversations, so keep it for human tickets only |
| First contact resolution | Issues solved in one conversation with no return ÷ all solved issues × 100 | Counts the customer’s result, whether the agent or a person finished it |
| CSAT | Satisfied responses ÷ all survey responses × 100 | Needs a split by who owned the conversation |
| Customer effort score | Sum of effort scores ÷ number of responses | Shows loops and repeated questions that CSAT can hide |
| Knowledge gap rate | Conversations with a question the agent could not answer ÷ conversations the agent started × 100 | New, and it points to the source or action to add next |
| Cost per ticket | Total support spend ÷ conversations and tickets handled | Spend now includes the platform plan and AI credits |
| Tickets per 1,000 orders | All customer contacts ÷ orders × 1,000 | Agent conversations count as contacts, or demand looks smaller than it is |
The outcome rows carry the most weight, and the choice between the first two decides how the rest of the dashboard reads.
The outcome group answers one question: did the customer’s issue end with the agent, with a person, or not at all.
Deflection was the natural headline when self-service meant a help center, because the only thing you could see was whether a ticket got created. With an agent in the chat, you can see how the conversation ended. A deflection rate still counts the customer who closed the window without an answer. It also counts the one who got a wrong answer and phoned instead.
Goodhart’s law says that a measure chased as a target stops measuring the work. Deflection is easy to chase: hide the contact option and the number climbs while customers get less help. Resolution rate resists that, because the returns come out of the top line.
Deflection tells you the customer did not reach your team. Resolution tells you the customer did not need to.
That difference is the gap between answering and resolving a support question. When set up correctly and maintained, YourGPT agents resolve up to 90% of repeated queries autonomously. Your own rate depends on which questions repeat in your queue and which actions the agent can reach. The fair comparison is your own last month.
Handoff rate and the 72-hour return rate sit beside the headline as its two checks. A falling handoff rate with rising returns suggests the agent is holding on to conversations it should pass along. The speed group needs the same care, because both of its numbers were built around human work.
Speed metrics measure how long a customer waits and how long the work takes. Both definitions still hold, but each one now blends two kinds of work.
With an agent answering first, blended first response time drops to seconds and stays there. The number looks good every month and stops telling you anything. The wait that still matters starts at the handoff, so track time from handoff to the first human reply as its own figure. That is the delay a customer feels after they asked for a person.
Average handle time means little for agent conversations. An agent conversation lasts as long as the customer takes to type and read. A long one can mean the agent walked someone through a five-step return, or that it was going in circles. The clock cannot tell those apart, so read long agent conversations in the transcript instead of timing them.
Keep average handle time for human tickets, and expect it to move for a reason that has nothing to do with effort. Once the agent takes the repeated questions, the tickets left for people are the harder ones. A rising human handle time after launch can mean the easy tickets left the queue. Check the handoff reasons before you read it as a slowdown.
Speed shows how fast the queue moves. Whether the customer left satisfied is a separate question for the quality group.
Quality metrics ask the customer, or watch what the customer does next. Four of the 12 live here.
First contact resolution now measures something different from resolution rate. If the agent passes a conversation to a person who solves it in the same chat, the customer still got it done in one contact. Count that as first contact resolved, and leave it out of the agent’s resolution rate. We cover how AI improves first contact resolution in a separate guide.
CSAT needs one change before you trust it: tag every response with who owned the conversation, whether that was the agent alone, the agent then a person, or a person alone. Handed-off conversations carry the wait and the repetition, so they can score differently. Blending the three hides where the dissatisfaction started. Effort score catches the same problem from another angle, because a customer who had to ask twice may still rate the final answer as satisfying.
Knowledge gap rate is the metric that tells you what to fix next. Each gap is a question with no source behind it, a source that contradicts another, or an action the agent cannot take. Our guide on why AI agents give wrong answers covers the conflicting-source case. Quality tells you whether the service worked, and the cost group tells you what it took to deliver.
Cost metrics connect support to the business. Two of the 12 sit here.
Put everything in the spend line: salaries, help desk seats, the agent platform plan and AI credits. YourGPT bills through AI Credits, and credit use depends on the model and on conversation workload. Credits vary month to month, so they belong in the monthly figure.
Then report two versions. A blended cost divides all spend by all conversations. A human cost divides people’s cost by the tickets people handled.
The blended figure falls when an agent conversation costs less than a human ticket. The human figure can rise at the same time, because people now handle the harder tickets. Reporting only one of them invites the wrong conclusion. For the return side of that calculation, our guide to AI agent ROI walks through the value model.
Tickets per 1,000 orders measures demand for support, normalized for sales. Count every agent conversation as a contact. If you count only the tickets people saw, demand appears to drop the month the agent goes live, even though customers ask just as often. A subscription business can swap orders for active accounts and keep the same logic.
All 12 formulas assume the agent’s events are clean enough to count, and a few parts of the setup decide that.
Each part below feeds at least one metric in the sheet. If one is off, the error carries into every number that uses it.
For a quick starting split, the Get AI Resolution Stats endpoint returns session count, AI-resolved count and escalate-to-human count for a date range. It counts sessions, though. It does not apply the 72-hour return check or the eligibility filter, so treat its AI-resolved count as the upper bound of your resolution rate.
Top intents, one of the other chatbot analytics worth watching, help explain where the handoffs come from. With clean events in place, one month of data is enough to set the baseline.
A baseline is last month’s value for each metric, written down with the exact definitions you used. Every later month is judged against it.
Here is a hypothetical month to show the arithmetic. A store takes 10,000 orders and receives 1,500 customer conversations, all answered first by the agent.
Of those conversations, 1,200 were eligible. The agent completed 960 without a handoff, and 48 of those customers came back with the same issue within 72 hours. The agent passed 240 conversations to a person.
| Metric | Calculation | Baseline |
|---|---|---|
| Resolution rate | (960 − 48) ÷ 1,200 × 100 | 76% |
| Deflection rate | (1,500 − 240) ÷ 1,500 × 100 | 84% |
| Handoff rate | 240 ÷ 1,500 × 100 | 16% |
| 72-hour return rate | 48 ÷ 960 × 100 | 5% |
| Tickets per 1,000 orders | 1,500 ÷ 10,000 × 1,000 | 150 |
Deflection reads 84% and resolution reads 76%. Of the 1,260 conversations counted as deflected, 300 ended with nothing completed and 48 came back within 72 hours. The gap between deflection and resolution is the work a deflection-only dashboard never shows you.
Keep the definitions frozen for at least three months. Changing the return window or the eligibility rule mid-quarter makes the trend meaningless. Once the baseline is set, the monthly review comes down to reading the numbers in pairs.
Any single metric can improve for the wrong reason. The check is a second number that gets worse when the first one improves for that wrong reason.
| If this improves | Check this | A warning sign |
|---|---|---|
| Deflection rate | 72-hour return rate and CSAT | Returns rise or CSAT falls in the same month |
| Handoff rate | CSAT on agent-only conversations | Fewer handoffs and lower scores from the customers who stayed with the agent |
| Resolution rate | Knowledge gap rate | Gaps grow while resolution holds, so a new topic is starting to arrive |
| First response time | Time from handoff to first human reply | Customers who ask for a person wait longer than before launch |
| Blended cost per ticket | Tickets per 1,000 orders | Contacts per order climb, so customers need help more often |
Report no metric without the one that can contradict it. A monthly review that opens with these five pairs catches the usual ways a dashboard misleads. The knowledge gaps then become the fix list for the month ahead.
A few edge cases come up once a team starts reporting against a baseline.
Yes, if the conversation was eligible. It stays in the denominator and never reaches the numerator, because a person finished it. A handoff on a conversation the agent could not have finished, such as a refund exception you route to people by design, is not eligible and leaves both sides. That split keeps the rate honest about the work you gave the agent, and first contact resolution still credits the person who solved it.
Keep the month and label it, or step back to the most recent month without the event. Deleting the busy days makes the baseline look calmer than your queue really is. If sales happen every quarter, keep one sale month as a second baseline and compare each future sale against it. Whatever you choose, write the reason beside the numbers so the next person reading the sheet knows why that month was picked.
Only as a rough signal. The agent handles the repeated questions, and your team handles the exceptions and disputes, so the two scores describe different ticket mixes. A team score below the agent’s does not mean people perform worse. Compare each owner’s score with its own baseline, and compare the handed-off group over time, because that group shows how the move from agent to person feels to the customer.
Start with resolution rate, handoff rate, 72-hour return rate and knowledge gap rate. Those four come from the conversation log and the Self-Learning list, and they tell you whether the agent is finishing its share of the work. Add CSAT once you have a survey on both agent and human conversations. Add cost per ticket at the end of the first full month, when the spend line includes a complete period of AI credits.
No. Wait for the baseline, then set the target as a change against it, such as a set number of points above last month. A target picked before you know your eligible share and your return rate is a guess. Our look at what a good resolution rate looks like for Shopify shows why the answer depends on the ticket mix of each store.
The 12 metrics still describe a support operation, but an agent in the queue changes which of them lead. Resolution rate takes the headline because it counts finished work that stayed finished. Deflection and blended response time move into supporting roles with a check beside each, and handle time goes back to measuring human work.
The baseline makes the rest usable. One clean month, with frozen definitions and the handoff counted from a single event, gives every later month something honest to be compared with. The knowledge gaps from that month become the list of sources and actions to add before the next one.
Train an agent on your help pages, connect handoff, then compare next month’s resolution rate.
Calculate cost per ticket with one formula and a free calculator, then compare it with the cost of a conversation an AI agent resolves.

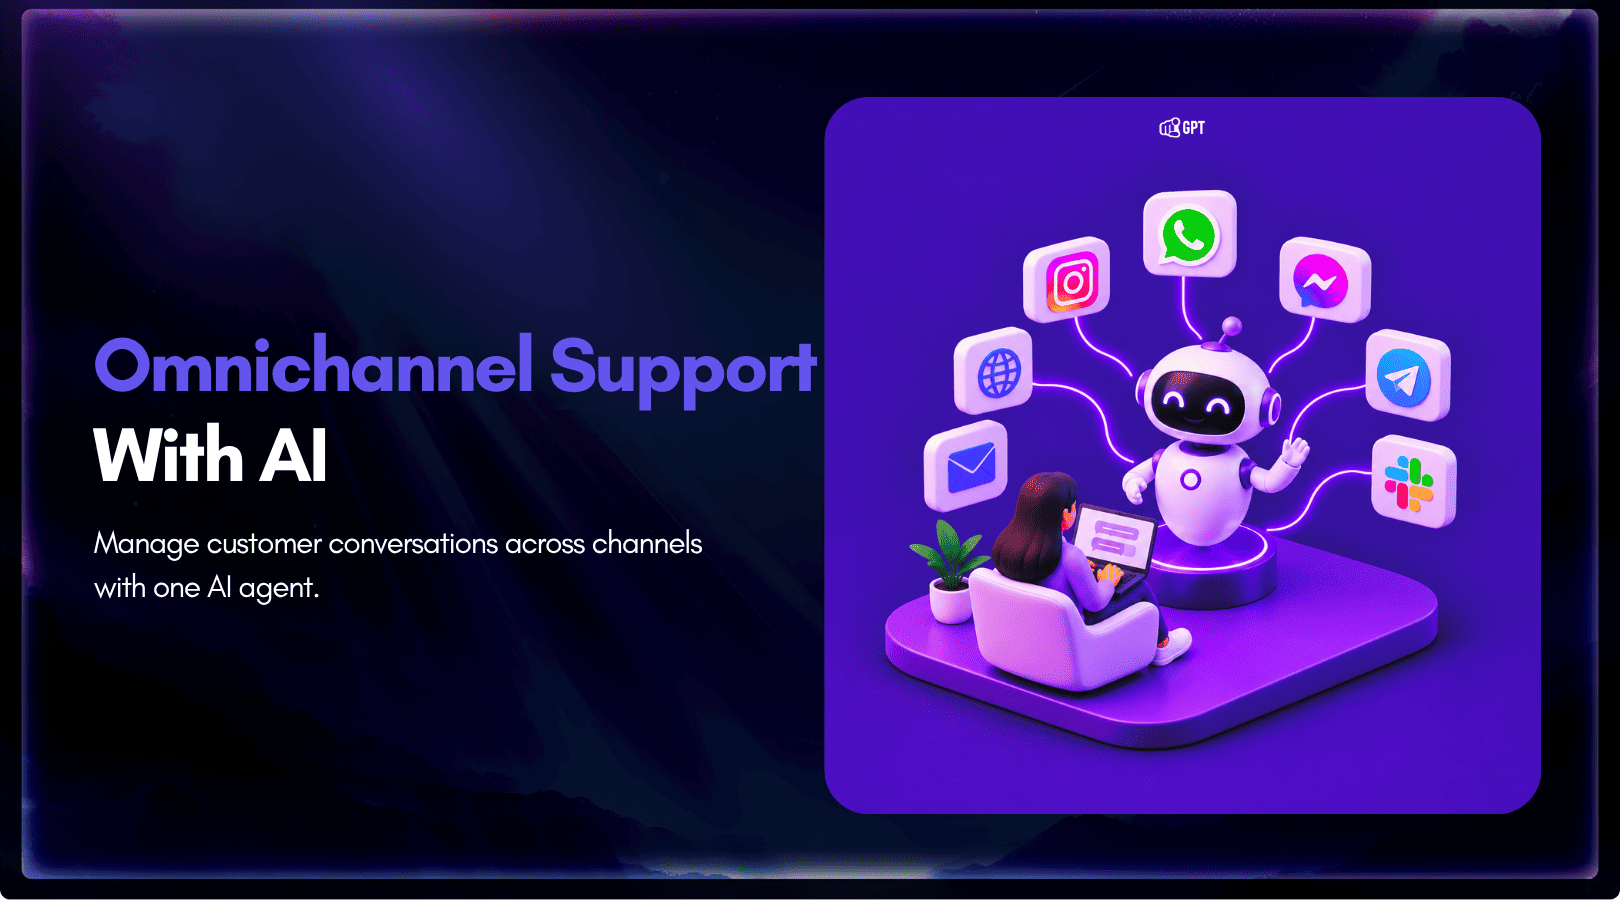
Omnichannel support means every channel answers from the same knowledge. Train one AI agent, pick your first channel, and test that answers match.
Self-learning AI agents log the questions they miss. Learn how human review turns those gaps into trained answers and how to run the weekly loop.
Train an AI agent on your return policy, connect the Shopify template in AI Studio to check real orders, and route exceptions to your team.
WISMO means Where Is My Order. Measure your WISMO share from last month’s tickets, fix the tracking gaps, and let an agent answer order status.

Run WordPress customer service alone. Train a YourGPT agent on your help pages, test it on real tickets, install the plugin, and get only the exceptions.